1. Introduction
According to PEW Research 1 , 96% of adults between 18-29 occasionally consult reviews before making a purchase. But does this mean that higher ratings result in more product sales? Specifically, what do higher ratings indicate for video game sales? Maybe higher ratings lead to more game sales. But could some more obscure games with a dedicated group of followers receive higher ratings than popular games with significant sales volume? I am also curious whether there has been an increase in the production of games in recent years and, if so, what affect this increase has on the quality of games based on review scores. Is it possible that an increase in the number of games results in review scores decreasing with the oversaturation of video game releases?
In this project, I plan to use Metacritic's user and critic review scores to see if there is a correlation between the scores of a game and its overall sales. I will be joining the review data with sales data obtained from VGChartz.
2. Data
This project uses two primary sources of data: Metacritic's game critic and game player review scores of different games and VGChartz data about video game sales.
2.1 Review Scores
I collected data from Metacritic, which contained user (user score) and critic (meta score) review scores for each game.
Metacritic's data was found on 186 different web pages. I wrote a web crawling script to collect all data across these 186 pages. I collected the game title, summary, platform, user score, meta score, and release date for 18,526 games. Some of the results were the same game that was released on different platforms, which is essential to consider when I begin merging the data. I created a data frame which is contained in the Metacritic.csv file in the project folder. The web crawling script that I wrote is contained in the metacritic.R file in the project folder.
The data didn't need much cleaning; however, to make the platform match with the VGChartz data, I created a dictionary to convert Metacritic's platform data to match VGChartz. This cleaning was done in the file combining_vgs.R.
2.2 Video Game Sales
The website VGChartz provides sales data about the number of units of each game/platform combination sold. The information was contained in 1,249 web pages. Due to the extensive nature of the data, I decided to break the web crawling results into six different CSV files (VGChartz_0 - 5.csv), all contained in the project folder. The web crawling script is contained in the vgchartz.R file in the project folder. I collected the game, platform, release date, publisher, and sales data from PAL, Japan, and North America as well as total game sales for 62,398 games. Like the Metacritic data, some of these games were released on multiple platforms, which count as a unique observation in the data. Another interesting thing to note is that series were counted in this data frame alongside their individual counterparts. For example, Super Mario is counted as a series, but each entry in the series is also contained in the dataset. This was handled in the cleaning of the data. In cleaning the data, I merged all six VGChartz .csv files into one complete file using row bind to build a complete data frame. I also removed unnecessary columns, trimmed the white space on the title, and returned only the distinct values of the dataset. When I read the CSV into the script, I created NA values where data was missing. I also removed the game series by filtering them out during data cleaning. This cleaning was done in the file combining_vgs.R.
2.3 Combining Reviews and Sales
Since both data sets included the same game title multiple times based on the platform, I had to merge based on both the game title and platform. Both data sets are also vastly different in the number of observations. I decided to create two separate data sets in merging. One data set is the intersection of the data and only contains data that appears in both data sets. The other data set, called the union, contains all rows from both data sets. All this work was done in the combining_vgs.R file in the project folder. Next I imported both data frames into the cleaning_vgs.R file in the project folder for further cleaning.
Since the differentiator between both data frames is their number of rows and most of my cleaning was regarding the columns, I created a function to iterate over both data sets to clean them. This cleaning included trimming the white space on the summary and publisher, turning the sales data into numeric, and adding the platform, publisher, and title as factors. I also turned all the release dates into a “Month, Year” format and combined the release date from VGChartz and Metacritic into one column. Next, I dropped all sales data except North America sales and total sales. I also dropped the extra release date column, and the index columns. I exported these datasets to VGSales_union.csv and VGSales_intersect.csv, respectively. The union had 68,288 observations, and the intersect had 12,288 observations. A description of each variable is contained in Table 1.
| Column | Type | Source | Description |
|---|---|---|---|
| game_title | Text | both | Title of game |
| platform | Text | both | Abbreviation of the video game console used to play the game |
| publisher | Text | VGChartz | The publisher of the video game |
| na_sales | Numeric | VGChartz | The number of units sold in North America |
| total_sales | Numeric | VGChartz | The total number of units sold worldwide |
| summary | Text | Metacritic | A description of the video game |
| release_date | Date | both | The month and year that the game was released |
| meta_score | Numeric | Metacritic | The review score as decided on by game critics |
| user_score | Numeric | Metacritic | The review score as decided on by the users of Metacritic |
Analysis
3.1 Video Game Ratings and Sales
I wanted to find out whether games with higher reviews sell more and navigate the relationship between the different types of sales and review scores. I started by calculating correlation coefficients to explore the relationship between variables. There was a correlation coefficient of .954 between the total sales and North American sales. This is evidence of an extremely strong correlation between these two variables. North American sales make up 48.7% of the total sales, which is a significant reason for this strong correlation. However, the correlation between sales and review scores was very weak. The correlation coefficient between total sales and meta score was .248, and it was .102 between total sales and user score. While there was a moderate correlation between user score and meta score at .524, it is nowhere near as strong as it was between the two sales variables.
I first thought this weaker correlation might be due to the difference in rating scales between the two groups of people. To prove this was not the case, I created a boxplot of the two scores, using ggplot . This plot is shown in figureure 1. While there might be slight differences in the interquartile range, the medians of the two variables are the same. However, taking the difference between their means results in a value of 1.67, which is somewhat significant. A histogram that compares the two variables, such as the one in figureure 2, gives us a good insight into the reason behind the difference in means. We can see that the meta scores have much higher counts of high reviews, while the user score has a greater number of low reviews. This may be part of the reason why the meta score has a slightly better correlation with sales than the user score.
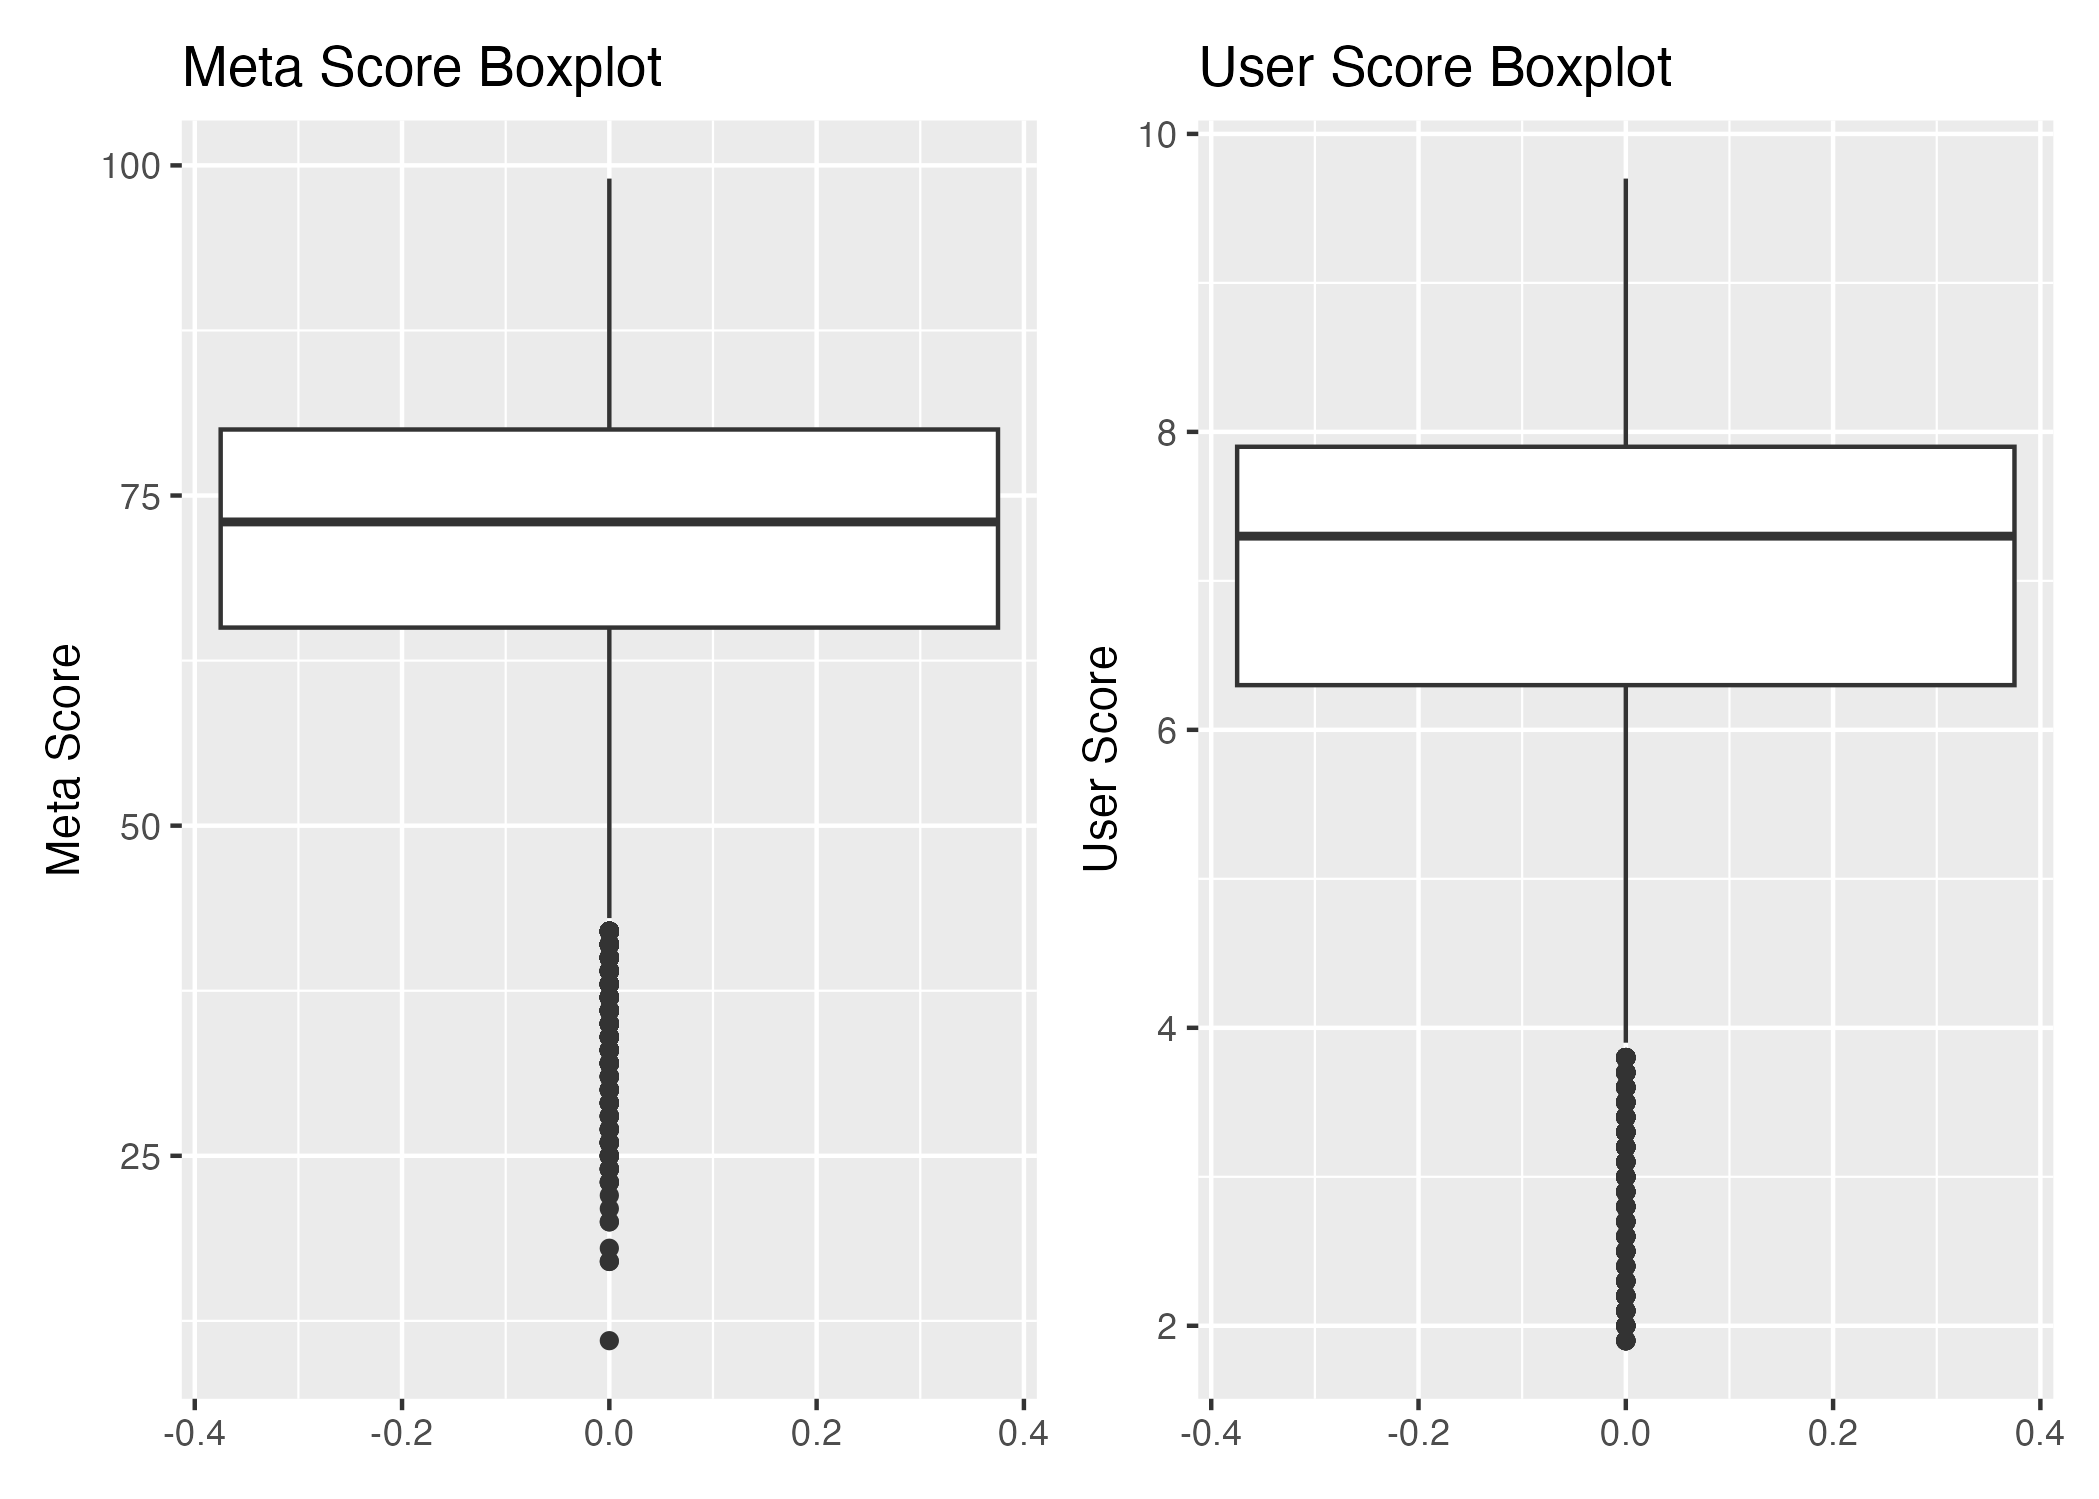
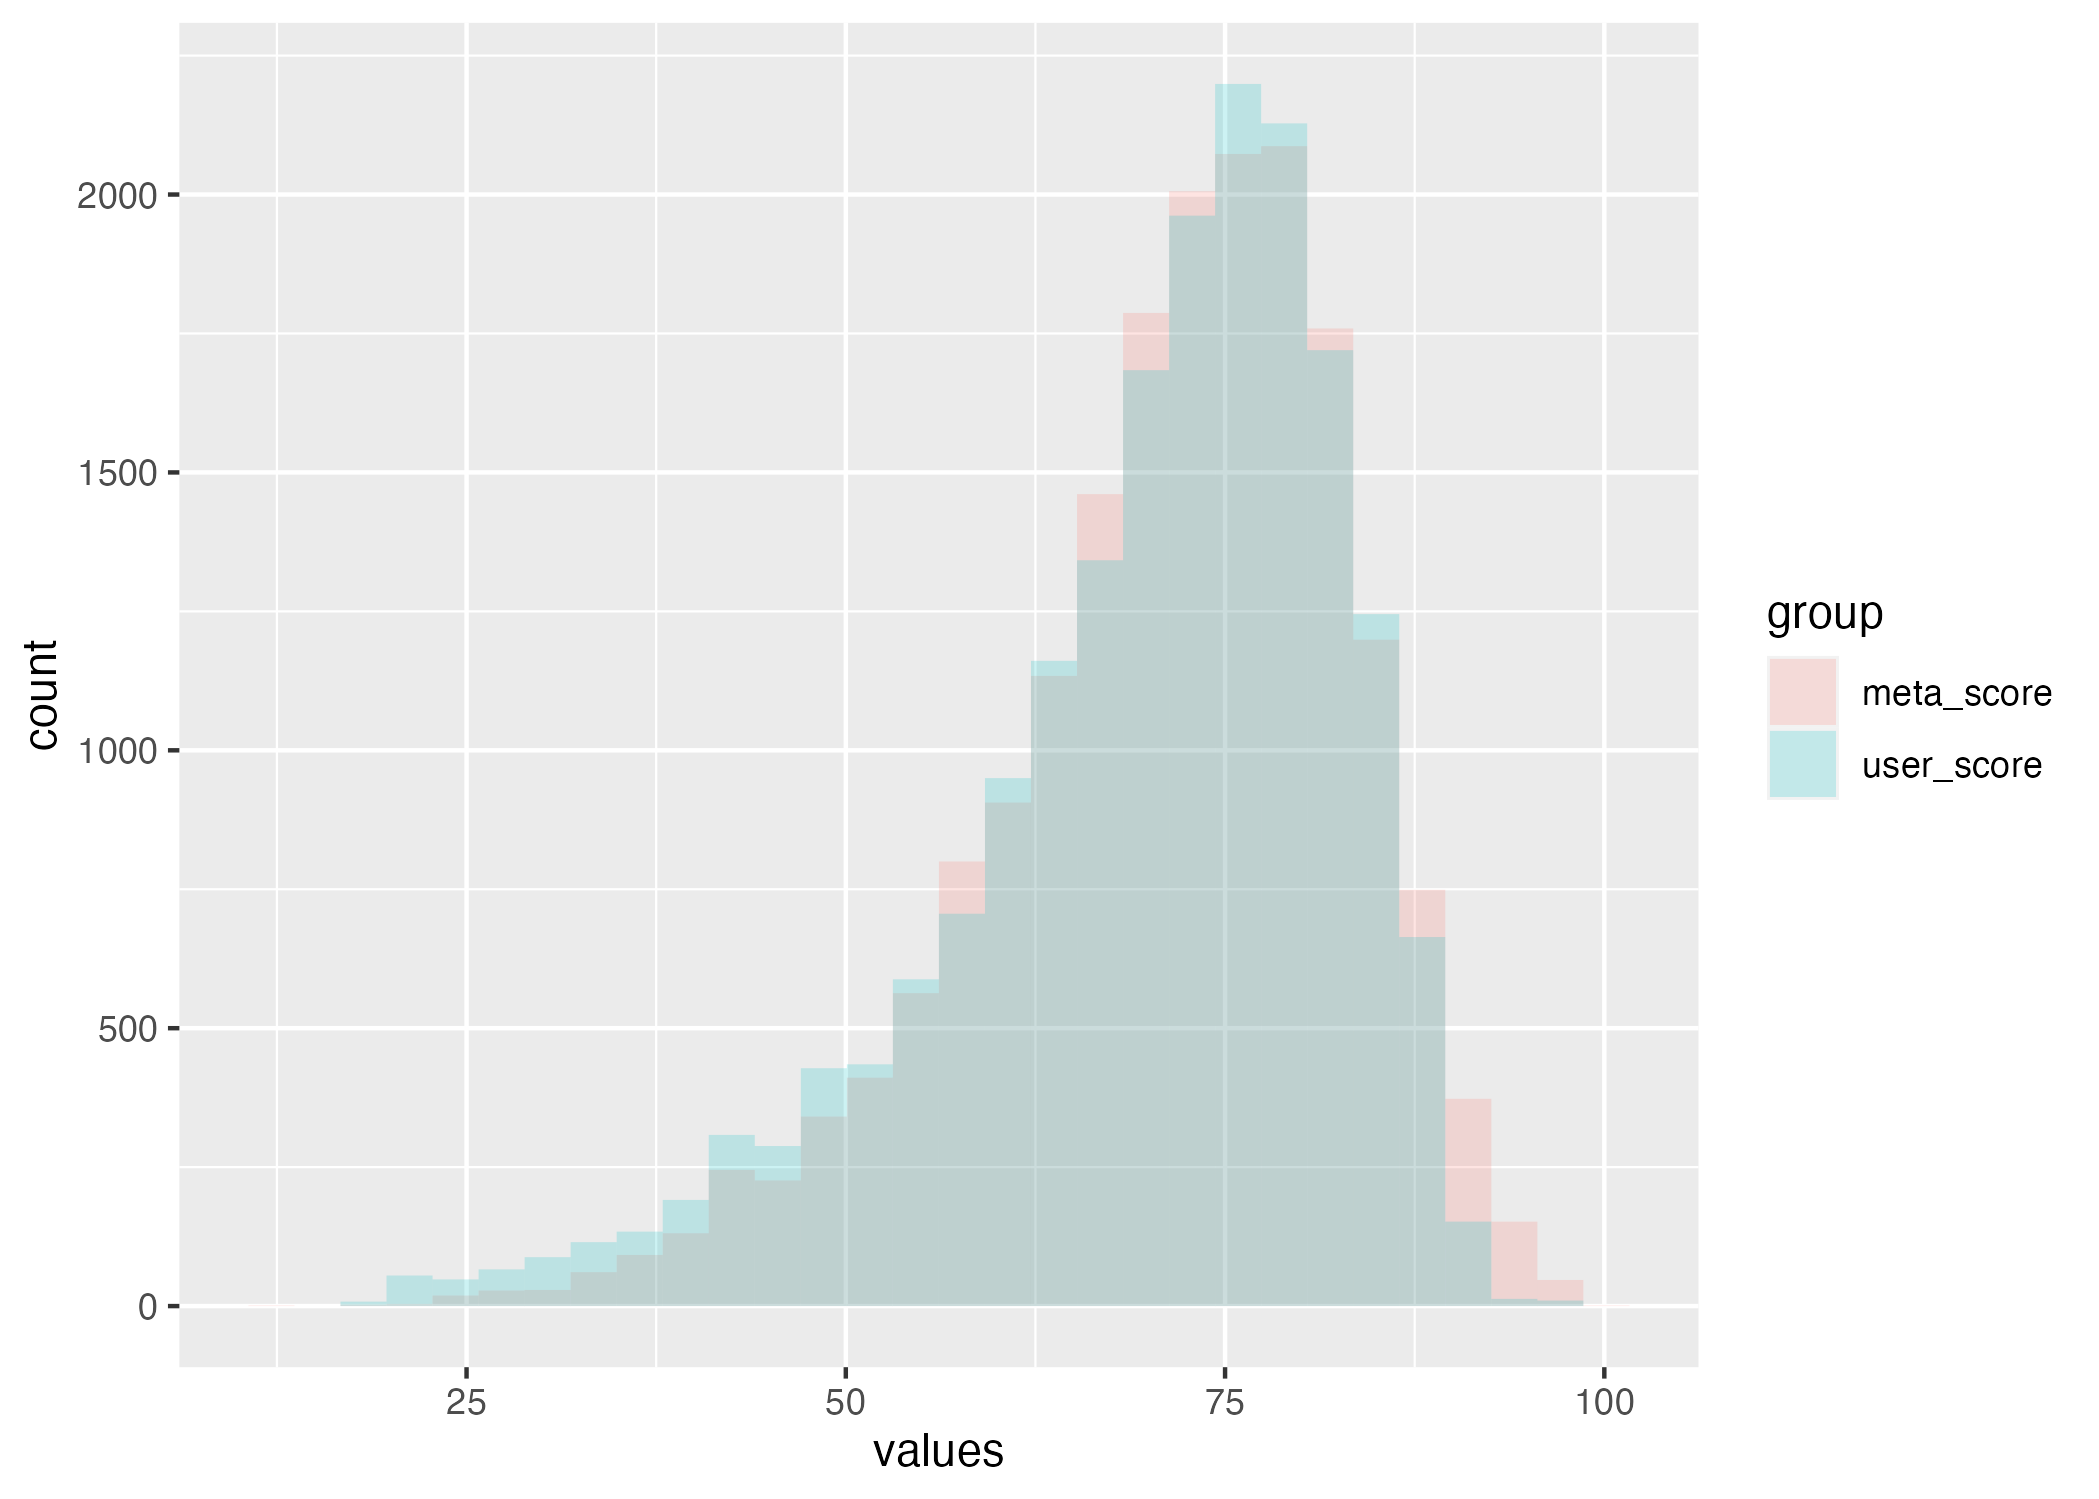
The meta score is a better predictor of sales than the user score. While the correlation isn't very strong, it does exist. There is some basis for the reason behind this correlation. Many companies send out review copies to critics in hopes that the reviews will boost sales . Critics usually publish their review scores in the days before a game is released. This increases excitement around the game before the general release date benefitting both the video game company and the critic.
However, the correlation appears to show that there probably isn't as much benefit in this manufacturer critic relationship as the manufacturer would like. I initially thought the weak correlation might be due to the large number of games with little sales. I recalculated the correlation coefficient between meta score and total sales which produced even less of a correlation at .065. While high review scores may help a company's reputation, they do not correlate well with more sales.
3.2 Video Game Publishers
To find out which video game publishers have the highest sales, I created a summary data frame, publisher_df, which was grouped by the publisher. In this data frame, I included the ratings' average, the sales' sum, and the number of games each publisher has released. To find the publishers with the highest sales, I took a slice_max of the data frame based on the total sales. The result appears in Table 2. The information is also saved in the publisher_sales.csv file in the project folder.
table 2 - slice max summary
| publisher | total_sales | na_sales | user_score | meta_score | number of games | |
|---|---|---|---|---|---|---|
| 1 | Nintendo | 1915460000 | 859150000 | 7.86772727272727 | 77.3954545454545 | 1410 |
| 2 | Activision | 727710000 | 428300000 | 6.80404858299595 | 70.9635627530364 | 1567 |
| 3 | Electronic Arts | 659150000 | 329130000 | 6.94391891891892 | 73.8192567567568 | 1591 |
| 4 | Sony Computer Entertainment | 557090000 | 239880000 | 7.54783950617284 | 74.9845679012346 | 1365 |
| 5 | Ubisoft | 500080000 | 260830000 | 7.00683012259194 | 70.7302977232925 | 1646 |
| 6 | EA Sports | 497620000 | 276250000 | 6.72665036674817 | 79.1075794621027 | 800 |
| 7 | THQ | 339470000 | 208390000 | 7.26092715231788 | 69.0794701986755 | 1092 |
| 8 | Sega | 291080000 | 119560000 | 7.35538116591928 | 72.2959641255605 | 2191 |
| 9 | Capcom | 274690000 | 104710000 | 7.58064516129032 | 74.7507331378299 | 1062 |
| 10 | Rockstar Games | 263430000 | 125600000 | 7.75555555555556 | 82.9506172839506 | 175 |
I noticed that all but one publisher released at least 800 games. I calculated the correlation between the total sales and the number of games a publisher had released. The coefficient of correlation between these two variables was .715, which demonstrates a strong correlation between the number of games released and the total sales of a publisher. Because of this strong correlation, I thought creating a scatterplot between the two variables would be useful to analyze the data further. The scatterplot can be seen in figureure 3 below.
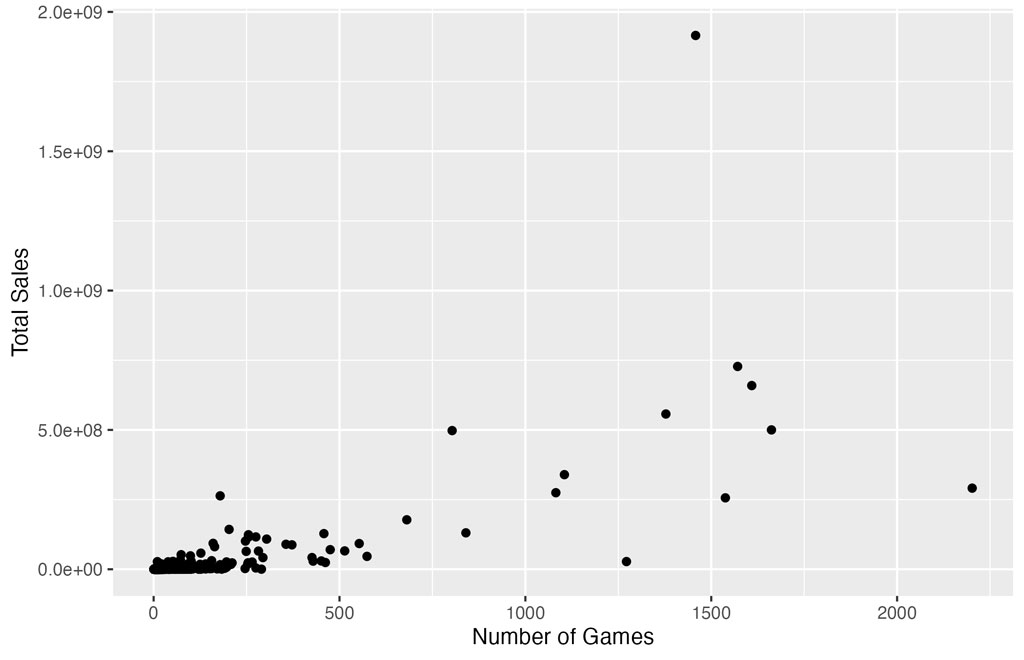
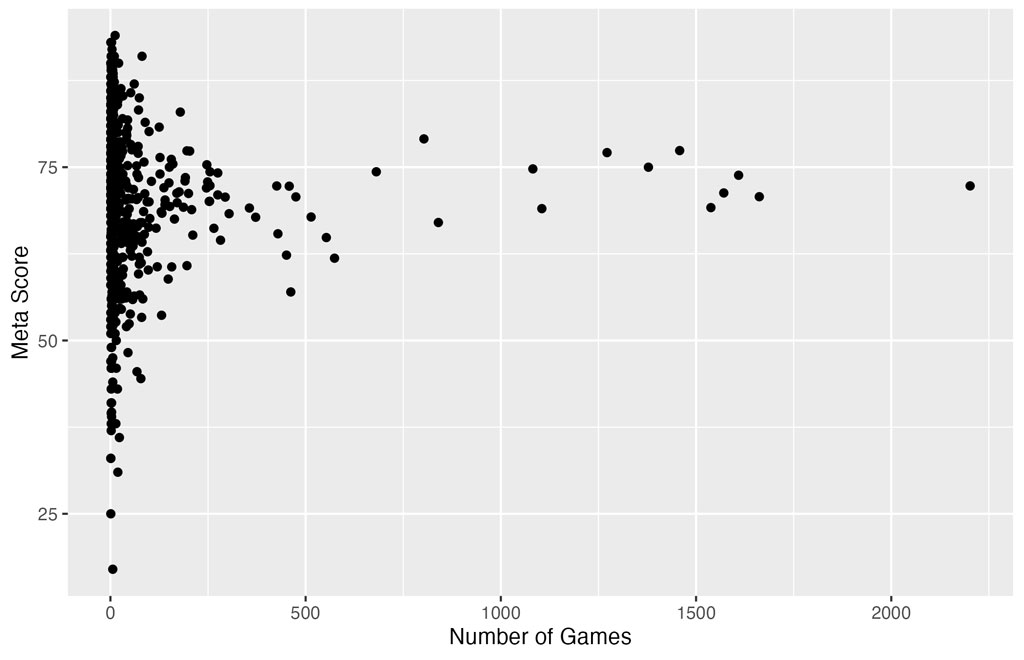
This correlation does not apply to the number of games released and the publisher's average meta score. The correlation coefficient between these two variables is -.013, which is evidence of no relationship between the number of games released and the average meta score.
With the strong correlation between the number of games and total sales, we can predict that a company's average meta score doesn't significantly impact its total sales. When we compare the average meta score of 71.145 to the values in Table 2 (above), we prove that meta scores and sales aren't strongly correlated, as 30% of the observations in Table 2 are below the average. This can also be seen in figureure 4, a scatterplot of the number of games released and the meta score.
Number of Games Released and Meta Score
I compared the top ten game publishers by North American sales and by total sales for the past ten years. I wanted to know if there is there a difference between those with high sales in North America and those with high total sales. Could another region be driving publisher sales success? I found the same game publishers in both lists, but in a slightly different order. Total sales ranged from about 260 million games to about 1.9 billion games. Games sold in North America was responsible for about 40 - 60% of the total sales numbers. More details can be found in the top_10_NA and top_10_total data frames. The top ten publishers appear in Table 3.
Table 3 - Top 10 Publishers Total Sales
| North American games sold | Total games sold | |
|---|---|---|
| 1 | Nintendo | Nintendo |
| 2 | Activision | Activision |
| 3 | Electronic Arts | Electronic Arts |
| 4 | EA Sports | Sony Computer Entertainment |
| 5 | Ubisoft | Ubisoft |
| 6 | Sony Computer Entertainment | EA Sports |
| 7 | THQ | THQ |
| 8 | Rockstar Games | Sega |
| 9 | Sega | Capcom |
| 10 | Capcom | Rockstar Games |
3.3 Release Date
To determine how sales, number of games released, and review scores have changed, I created a data frame called by_month, which grouped the games by month and calculated the average review scores, the sum of sales, and the number of games. To make the dates easier to use in a scatterplot, I decided to change the data type to date format. I did this by setting the column as a date with the day value being the first day of the month the game was released.
To start my analysis, I wanted to see if there is an increase in the number of games being developed over time. The correlation coefficient between the release date and the number of games released is .533, which is evidence of some correlation, but it is not especially strong. Next, I created a plot of the number of games released in relation to the date. I also compared the total sales of games over time, using the patchwork package , to see if there was a clear pattern between the number of games released and total sales. This scatterplot can be seen in figureure 5.
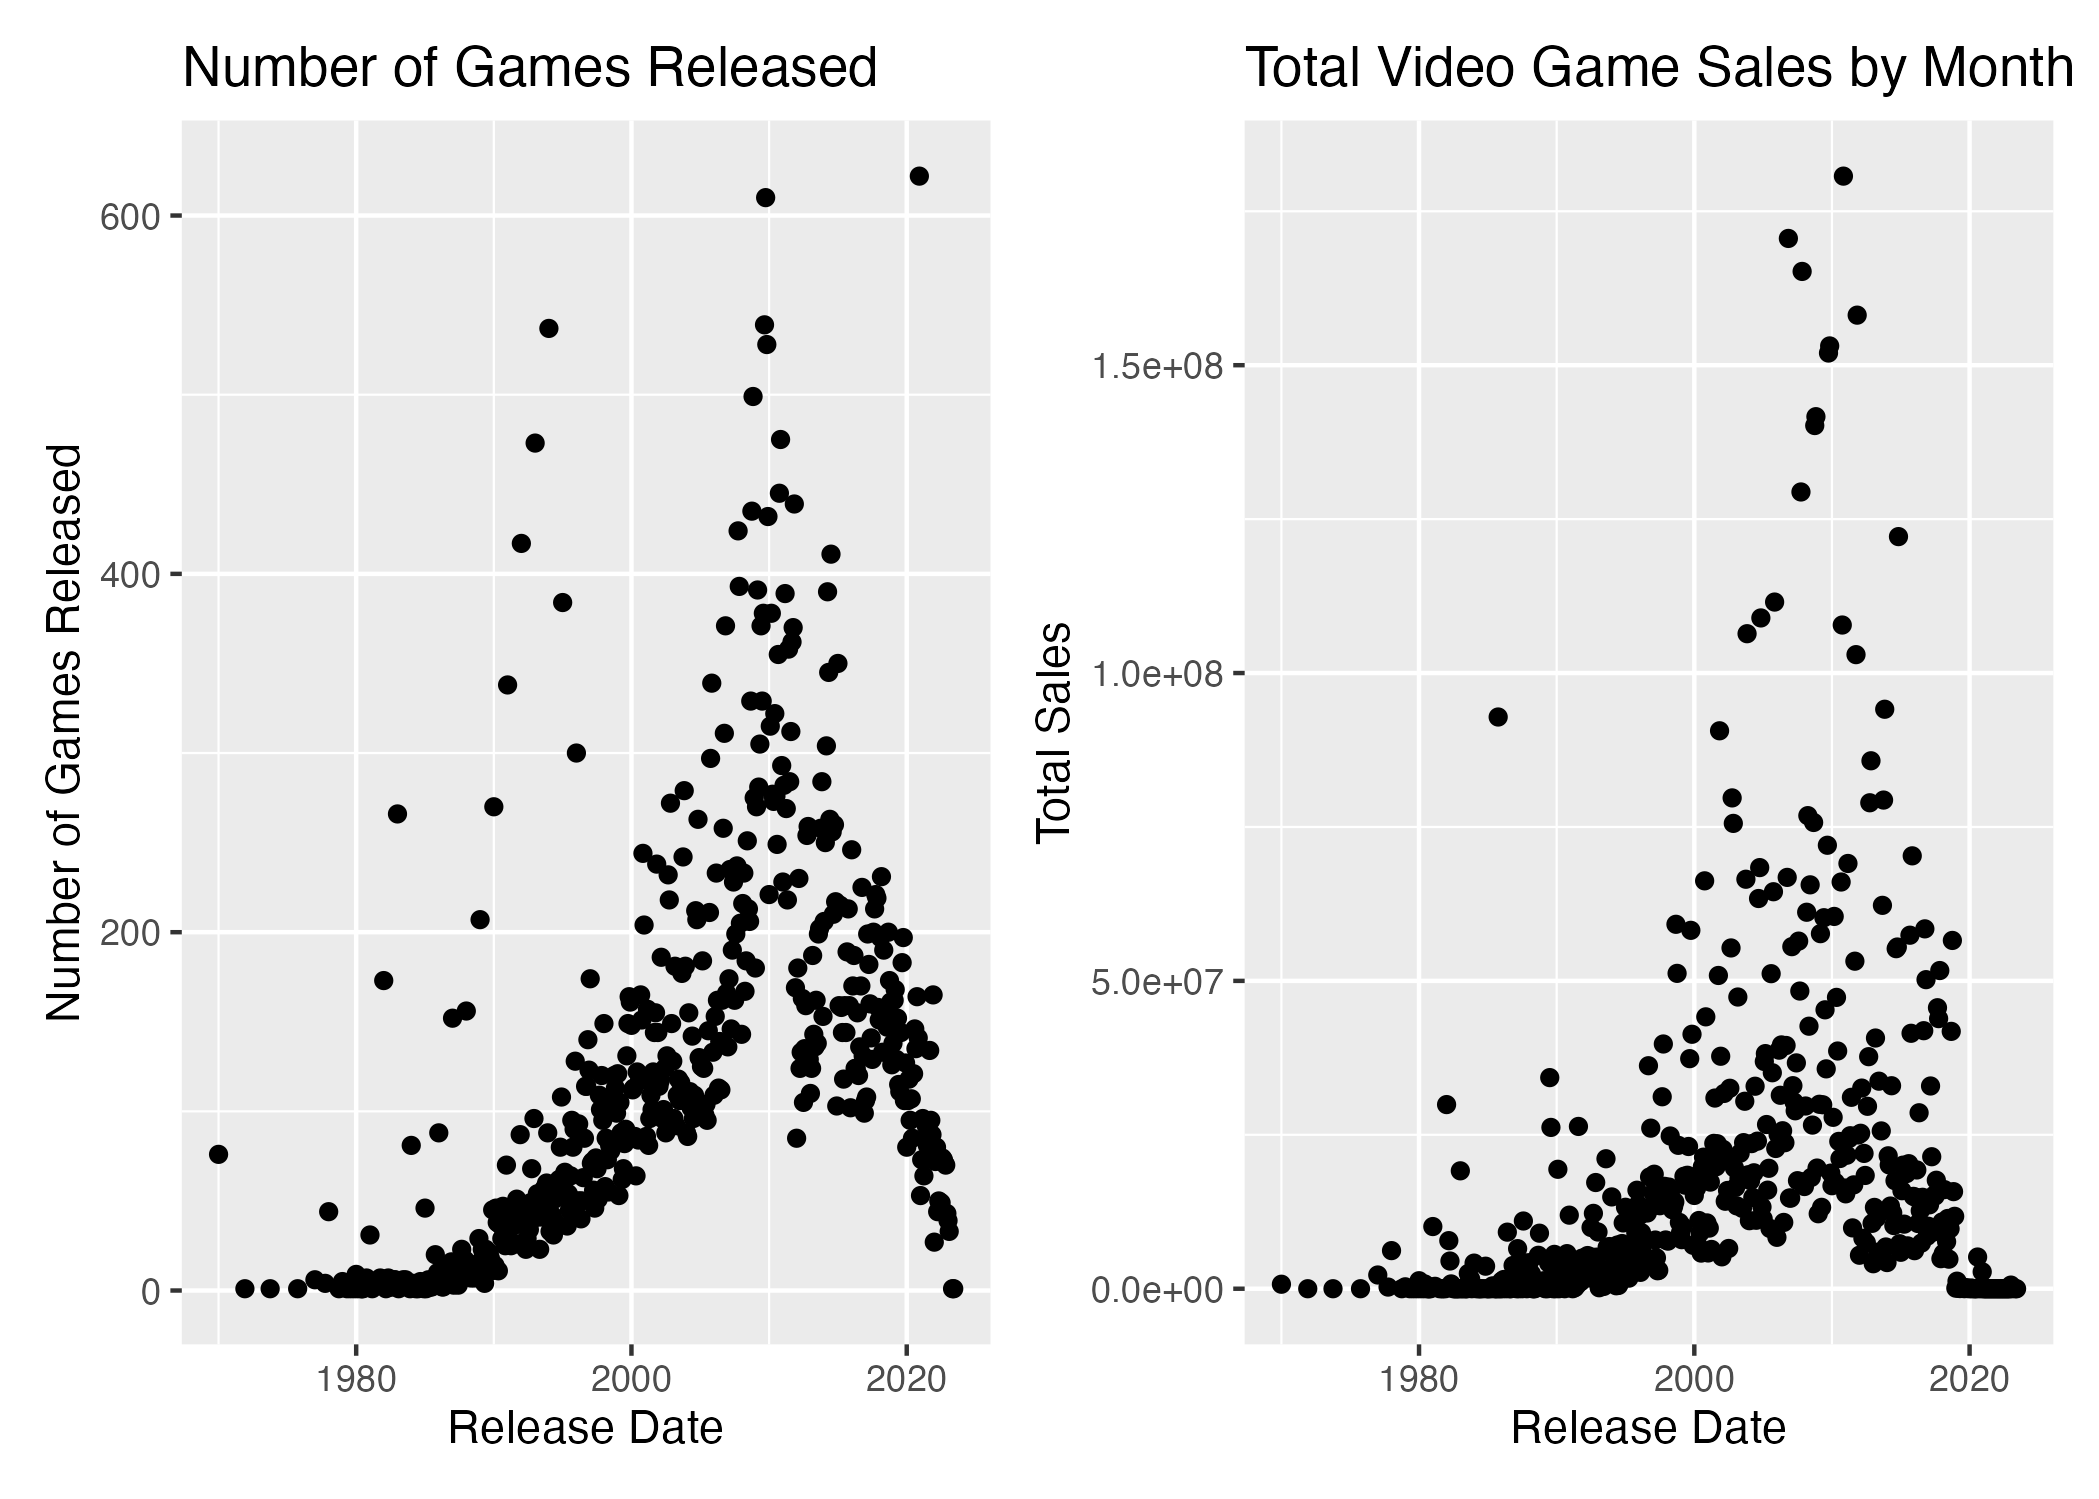
The point at the end should be ignored, as it includes two games yet to be released. The outlier of games released in 2020 should also be ignored, as many games were misclassified to this date by the websites.
figureure 5 reveals a large peak in the number of games released around 2010 before decreasing again. The sales of games did not see this same spike. The purchase of games released after 2010 remained somewhat consistent, unlike the number of games released in that same period. The increase in games around the late 2000s is likely due to the release of new video game consoles that reached many mainstream markets. Many video game consoles could also play Blu-ray discs and had multimedia features , which increased their popularity.
To further analyze sales, I looked at how the passage of time has affected sales globally versus in North America. The correlation coefficient between total sales and the release date is .273, much lower than for the number of games released and the release date. This also holds for the correlation between North American sales and the release date, which has a correlation coefficient of .229. figureure 6 shows a graph comparing the sales to the release date.
total sales by release date
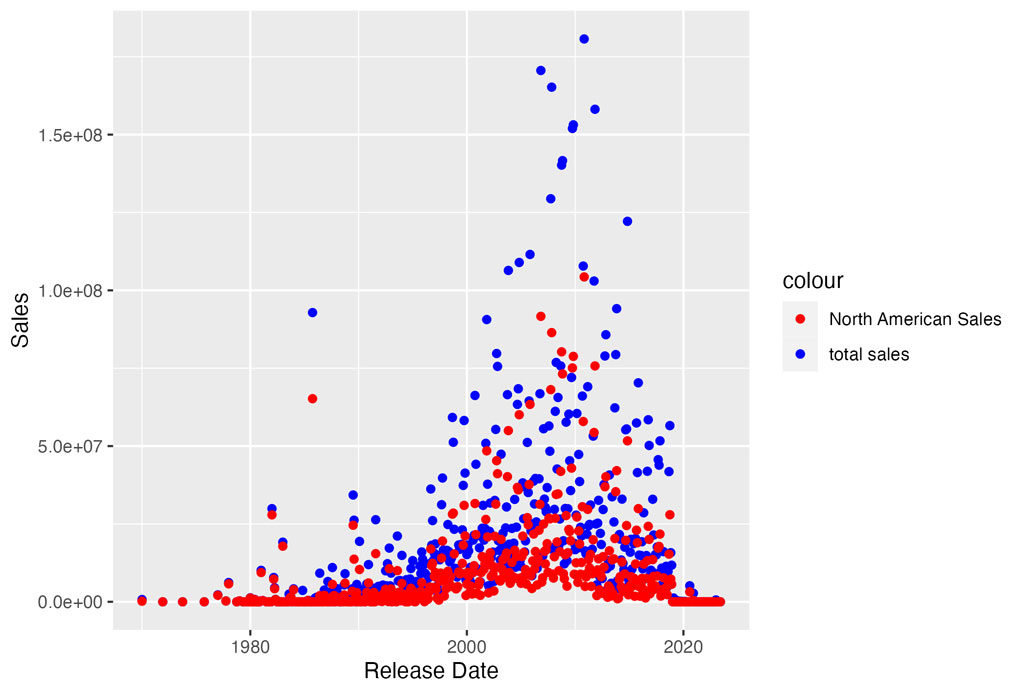
The trend of frequent outliers appears to be much greater for total sales than it is for North American sales. Taking a slice_max of both North American and total sales shows this pattern is likely due to increased sales during the holiday season. The top ten sales months for both these variables are in October and November. Many game publishers have caught on to the increase in sales during these months. Many of the months with the most games released are also in this timeframe. While there was an increase in sales throughout the 2000s, the same cannot be said about review scores.
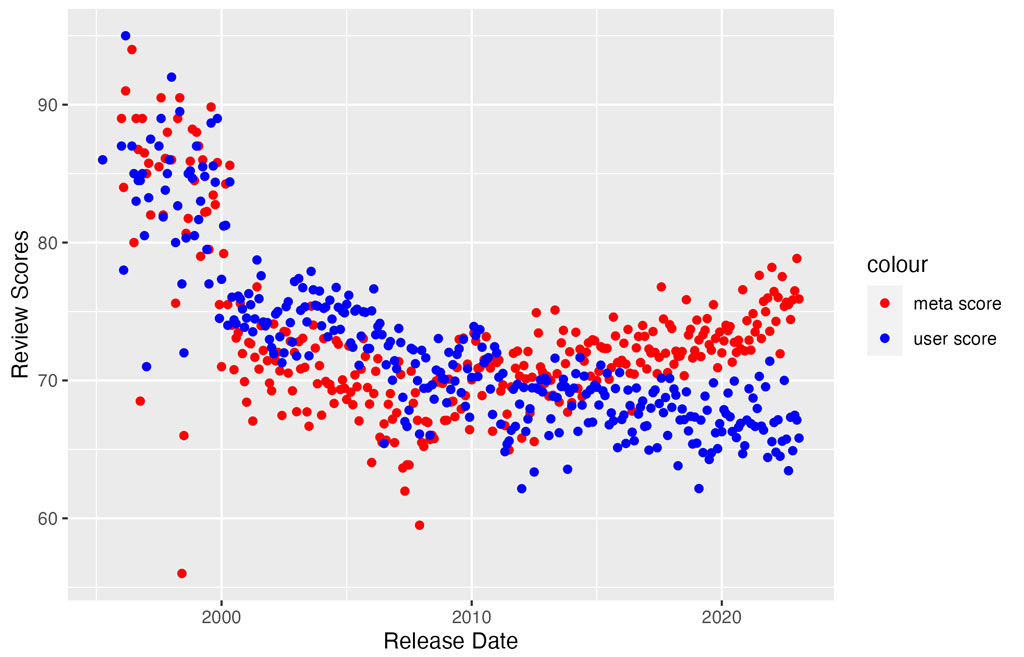
Figure 7 shows that the review scores of games see a sharp decrease beginning in 2000. However, the meta scores decreased much more drastically than the user scores during this time. While the meta score began to increase again around 2010, the user score continued to decrease. This is reinforced in the correlation coefficients of the two variables. The meta score has a correlation coefficient of -.325 with the release, while the user score has a correlation coefficient of -.837 with the release date. The difference in the direction of review scores after 2010 can partially explain the strong correlation value between the meta score and the total sales of a game.
Conclusion
In this project, I analyzed three aspects of video game sales: the publisher, the release date, and how a game's sales and review scores influence each other. In summary, from the analysis questions presented in my proposal, I found the following results.
- Is there a strong correlation between a game's review score and its sales? Is the meta score or the user score a better predictor of a game's sales?
- There is limited correlation between review scores and sales. But while the correlation isn't very strong, it does appear meta score is a better predictor of sales than the user score.
- Have the total sales of games seen an increase over the years?
- There is some correlation between release date and number of games released, but it is not especially strong. There was a peak in the number of games released around 2010 but since there has been a decline.
- Which publishers have had the highest sales over the past ten years? Is there a difference between those with high sales in North America and those with high total sales?
- The top ten publishers are listed above in Table 3. The same ten publishers are present in both total sales and North American sales, just in a different order. Nintendo is solidly in first place with 1.9 billion games sold followed by Activision at number two with 727 million units sold. North American sales accounts for 40 - 60% of total sales making this region a significant contributor to sales success for game publishers.
- Is the console on which a game is released strongly correlated to its ratings? Specifically, are there certain video game consoles that have the highest average ratings of games?
- The variables needed to answer this question were not present in the collected data. As noted below, this question would be an opportunity for further work on this project.
This project has several limitations, including the lack of review scores for games released before the mid-90s, the improper release dates of some games, and the lack of information about the video game consoles. Future work on this project could include finding more sources to create a more complete dataset, analyzing the purchase of different video game consoles to see if the spikes in new video game releases coincide with more people buying video game consoles, and analyzing whether more time in between game releases for a publisher really means a better game (higher sales and review scores).